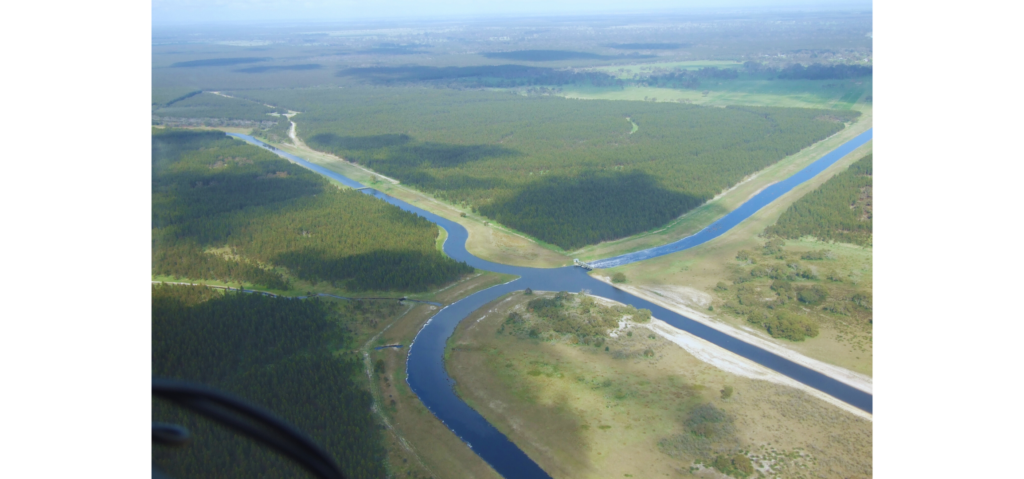
The Limestone Coast of South Australia has undergone significant transformation, evolving from a wetland-rich environment into a highly productive agricultural landscape. An extensive cross-catchment drainage system has played a key role in this shift, enabling the expansion of diverse agricultural enterprises and large-scale forestry plantations. These industries rely heavily on consistent rainfall and the region’s substantial groundwater resources to sustain production.
The Limestone Coast Landscape Board, South Eastern Water Conservation and Drainage Board and Goyder Institute for Water Research are collaborating on the research project, ‘Adaptation of the South-Eastern drainage system under a changing climate‘ aimed at supporting water security decision making in the Lower Limestone Coast. This project is jointly funded by the Australian Government through the National Water Grid Authority, the Limestone Coast Landscape Board and the South Australian Government. The findings from the project’s five key tasks are set for release in June 2025—an especially timely milestone given that rainfall from March 2024 to February 2025 was among the lowest on record. The results will also inform upcoming amendments to the Lower Limestone Coast Water Allocation Plan.
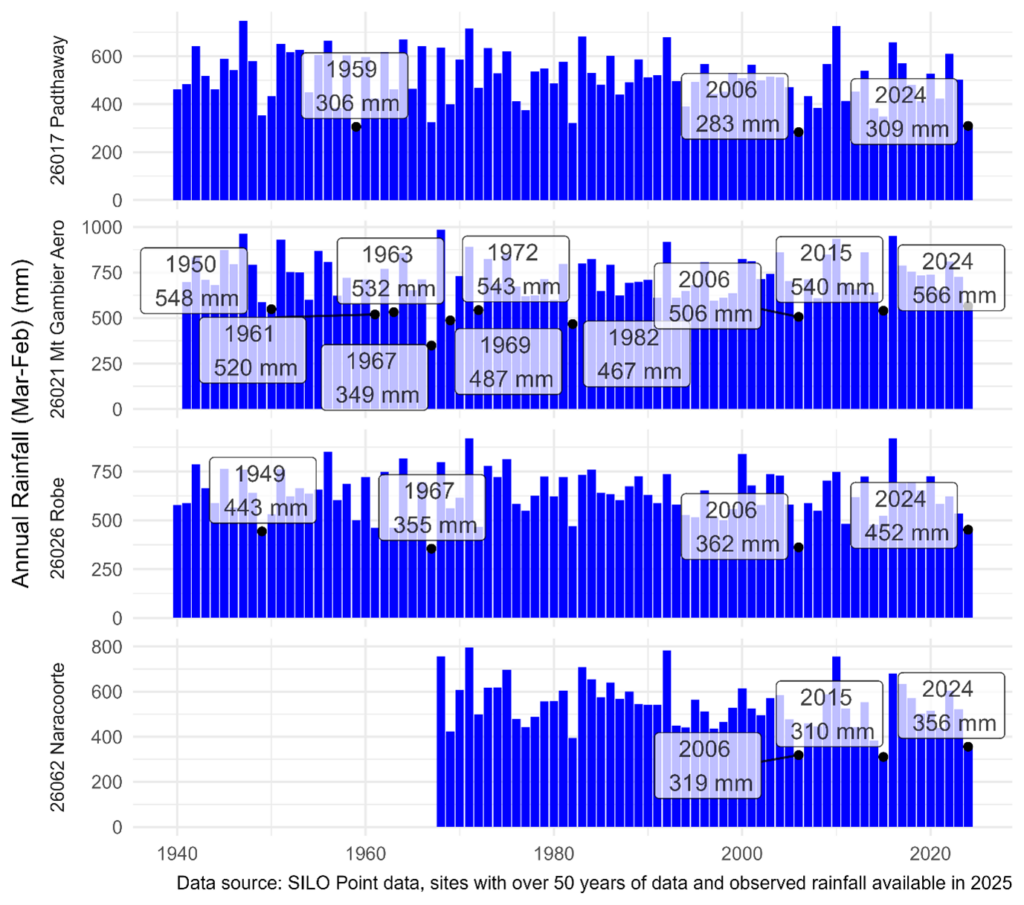
Figure 1 Annual rainfall (March to February) for stations across the South East, with years highlighted those lower than 2024-25.
One of the key tasks in this project focused on understanding the region’s water balance—both historically and into the future. This research helps identify opportunities for improved water management and addresses risks to agriculture and ecosystems posed by climate change.
Previous studies have either analysed long-term averages for the entire region or examined specific aspects of the water balance, such as runoff or recharge. In contrast, this study developed an integrated water balance model that simultaneously captures evapotranspiration, runoff, and recharge while accounting for seasonal dynamics and spatial variability. A region-specific version of the Australian Water Resources Assessment Landscape (AWRA-L) model was used, which is designed for water accounting and resource assessments across Australia.
To develop this region-specific model, an extensive data review was conducted. The model was calibrated using high-quality streamflow gauges in the region unaffected by regulation, remotely sensed leaf area index (providing insights into actual evapotranspiration), remotely sensed soil moisture, and groundwater level trends that reflect changes in water storage. The data revealed several key trends in historical water availability:
Rainfall has declined while temperatures have risen, consistent with broader observations across Australia.
- Recharge Reduction: Of the 65 unconfined groundwater management zones analysed, 57 showed declining recharge rates, with 31 of these trends being statistically significant.
- Streamflow Decline: Every streamflow station analysed recorded declining trends. Beyond reduced rainfall, the proportion of rainfall generating runoff has also decreased since the 1990s.
Using 21 global climate models from the IPCC’s Sixth Assessment Report, the study projected future water availability for 2060 under a medium emissions scenario (SSP 2-4.5). All models considered indicate a decline in mean annual rainfall, with three scenarios selected to represent the range in reductions: Dry (15%), Mid (7%), and Wet (2%).
Large reductions in runoff were modelled compared to the reduction in rainfall, with the slope of the relationship (or ‘elasticity’) of 4.2; that is, for a 1% reduction in rainfall on average, a 4.2% reduction in runoff was modelled on average. For recharge, the elasticity was lower but still representing double the reduction in recharge for a given reduction in rainfall.
Figure 2 illustrates the median annual volume of water available in the drainage network under historical and future climate scenarios (excluding losses from wetlands or diversion in the drainage network). The width of each watercourse represents median annual runoff, based on accumulating flow from upstream.
The main watercourses flowing to the ocean -Blackford Drain, Drain L, Drain M, the Mount Hope – Lake Frome system and the drains feeding into Lake Bonney are clearly visible. Wider sections of these drains indicate areas with higher water volumes. Under the Mid and Dry scenarios, median annual runoff is significantly reduced, with the Dry scenario showing declines of up to 50%. Despite a small reduction in annual rainfall, the Wet scenario resulted in similar or increased runoff compared to historical conditions, driven by a small increase in winter rainfall for this scenario.
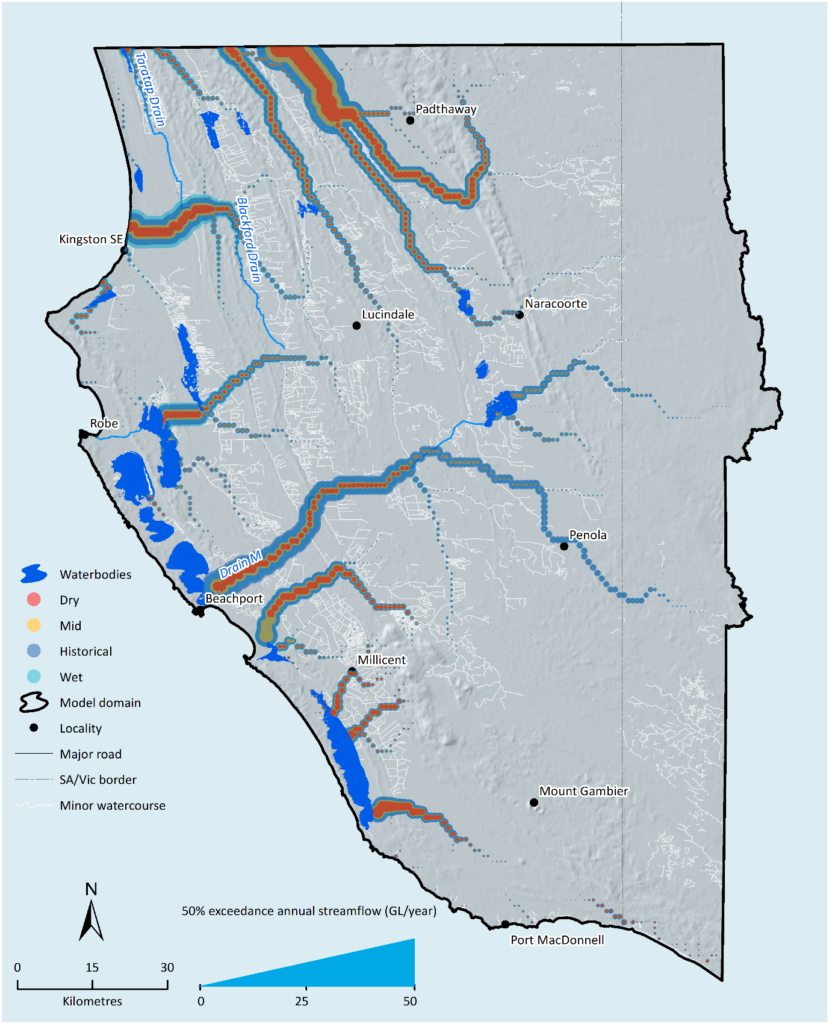
Figure 2 Schematic representation of median annual streamflow volume for historical and future climate scenarios
Trends in observed data show a decline in water availability in the region, a pattern that future climate projections suggest will persist. To manage surface water, the drainage network has been extensively modified to enable the diversion of water between drains, wetlands, and watercourses. However, due to low water availability over the past 15 years, some of these drains have seen minimal use. The study indicates that while the main drainage networks are equipped to divert water into wetlands to support environmental water requirements, there is unlikely to be enough water to consistently meet all these requirements on a regular basis.
More detailed methods and results will be available in the technical report on the Goyder Institute website in June. An interactive dashboard is also being developed to explore the water balance components further.
